AI を活用したアプリケーションをPython で構築するにあたり、UI をどうするかは迷うところです。前回の記事でFastAPI について解説しましたが、API はあくまでも機能の最小限の公開ですので、ユーザーフレンドリーとは言えません。例えばFastAPI をユーザーが使うにあたり、どのような入力をすればいいかはユーザーに一任されますので、せっかく開発したAPI を使うまでに時間がかかります。
そこで、そうしたアプリケーションを公開するためのわかりやすい入口としてのUI があるわけですが、Django やReact/Next.js など、機能が豊富なフレームワークで凝ったUI 実装をするのはなかなか大変です。
そこで本記事では、なるべく簡単にアプリケーションを公開するPython のフレームワークとしてのStreamlit を紹介します。
目次
Streamlit とは
Streamlit は、先述したように、なるべく簡単にアプリケーションを公開するためのUI を作るPython のOSS フレームワークです。HTML やCSS の知識も不要でPython で完結しますので、公開までのハードルの低さが魅力的です。一方で、Django やReact/Next.js のような柔軟さはないので、例えばFastAPI で構築したデータ分析用のアプリケーションをいち早くデータ分析チームに公開したい、といったような、商用環境というよりはどちらかというと凝った機能がそこまで必要のない社内利用のようなユースケースで威力を発揮します。
環境構築とデモアプリの起動
https://docs.streamlit.io/get-started/installation
まずはインストールしましょう。必要に応じてvenv を使って仮想環境を有効化してください。
pip install streamlitその後以下を実行すると、デモアプリが立ち上がります。ログにも出力されますが、デフォルトではhttp://localhost:8501 でアクセスできます。
streamlit hello(venv) streamlit> streamlit hello
Welcome to Streamlit. Check out our demo in your browser.
Local URL: http://localhost:8501
Network URL: http://192.168.0.11:8501
Ready to create your own Python apps super quickly?
Head over to https://docs.streamlit.io
May you create awesome apps!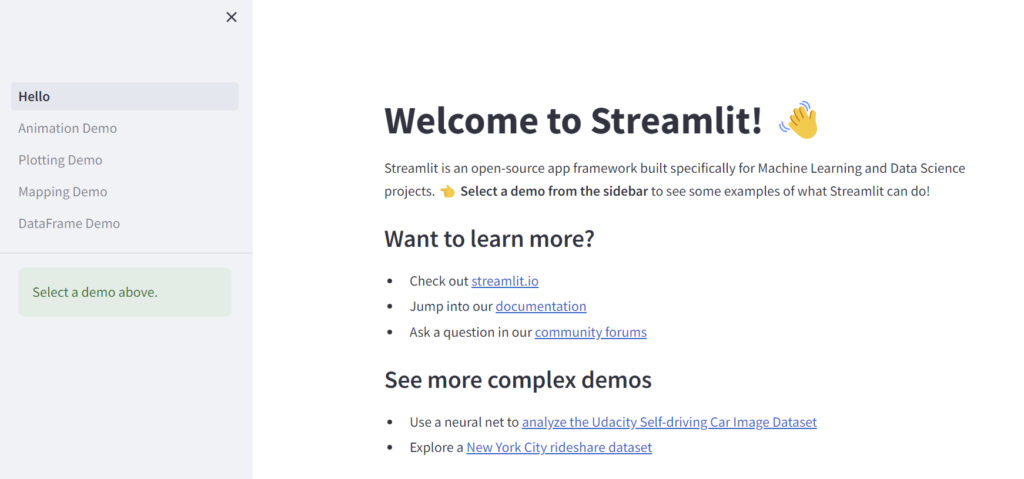
左ペインのメニューをクリックしながら別ページへアクセスすることで、Streamlit の大まかな機能が把握できるはずです。例えばdf 形式のデータをグラフに表示してチームで共有、といったことがCSV に落としてからエクセルで可視化というプロセスを経ることなく、アプリケーションでそのまま可視化できます。
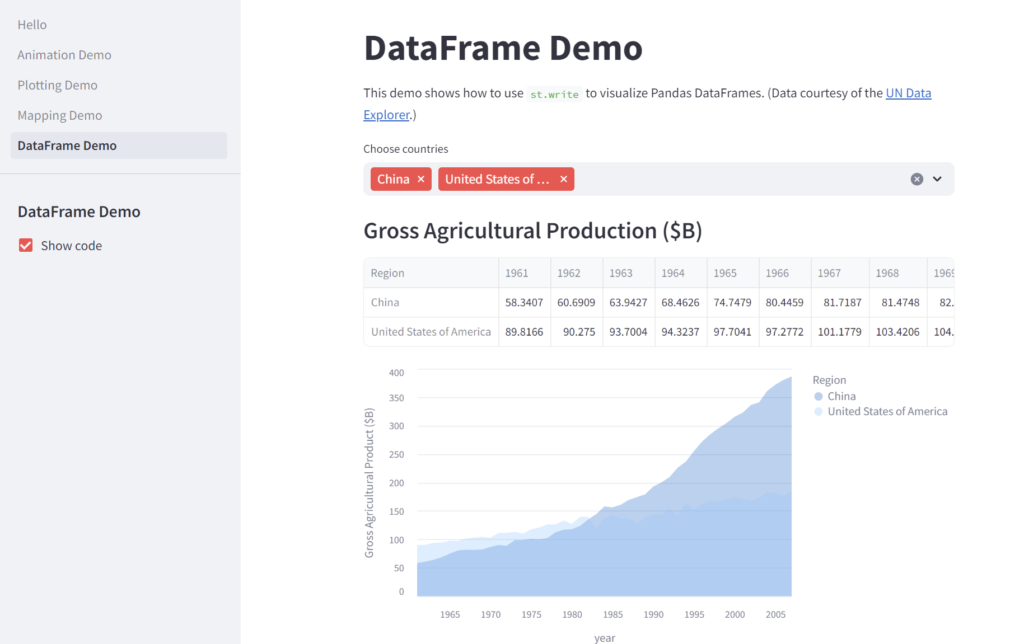
可視化はしばしばデータ分析の途中や最後でそのデータから知見を得るために行われますが、Python でそのまま可視化できるということは、知見を得た後のさらなる分析にすぐに取り掛かれるということで、そのスピード感がStreamlit の1つのメリットと言えます。また、データ分析以外にも、例えば機械学習による画像分析の入力インターフェースをStreamlit で用意することで、様々な画像(=異なる入力)に対応した画像分析機能を、Python のスキルセットにかかわらず誰に対しても提供できることもメリットです。
アプリケーションの開発
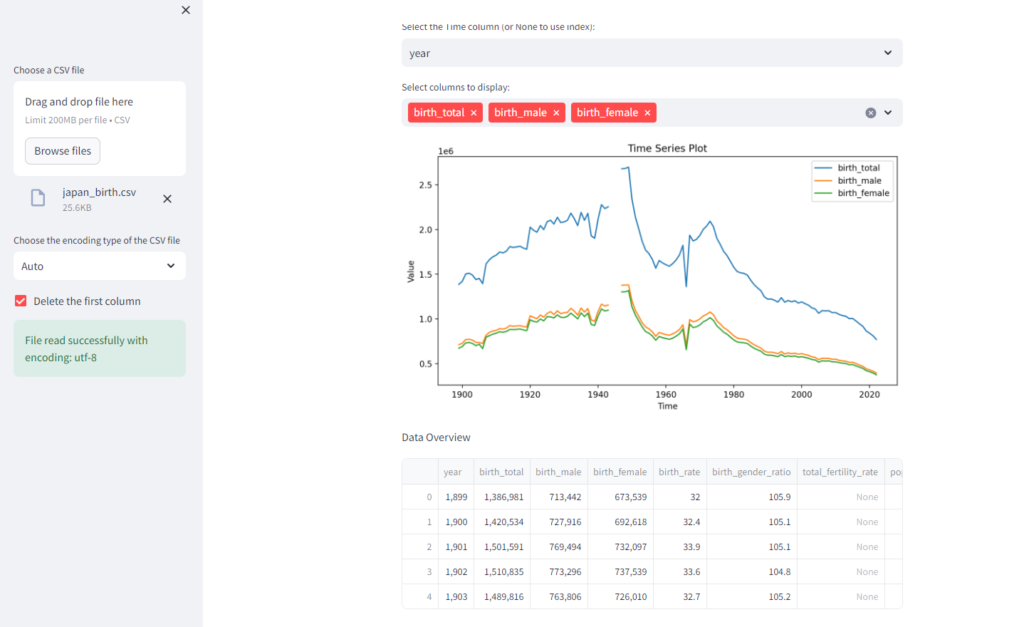
ここでは、Streamlit を使って一般的なデータ分析と可視化のためのアプリケーションを作成しながら、その機能を追っていきます。今回作るアプリケーションは下記スクリーンショットのように、様々なデータの概略をつかむことを目的とした、CSV ファイルの可視化アプリです。CSV をアップロードすると、データフレームに関する情報やデータに対する時系列表示を行えます。
早速作っていきましょう!なお、テスト用に今回は下記からダウンロードできる(要Kaggle アカウント)日本の出生率に関するCSV ファイルを使います。
https://www.kaggle.com/datasets/webdevbadger/japan-birth-statistics
ファイルアップローダー
https://docs.streamlit.io/develop/api-reference/widgets/st.file_uploader
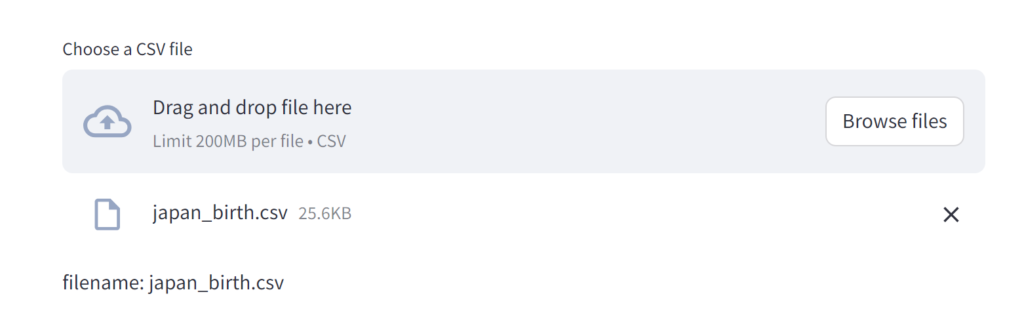
まずはCSV ファイルのアップローダーを設置してみます。
import streamlit as st

uploaded_file = st.file_uploader("Choose a CSV file", type="csv")

if uploaded_file is not None:
    st.write("filename:", uploaded_file.name)
とりあえずはこれをmain.py に保存して起動してみましょう。streamlit を起動する際は以下のようにします。
streamlit run .\main.py任意のCSV ファイルをアップロードして、ファイル名が表示されるところまでを確認します。
なお、今後アプリケーションに変更を加えていくわけですが、アプリ起動時に自動更新を有効化することでファイルの保存をトリガにアプリを更新して差分を自動反映させることができます。
streamlit run .\main.py --server.runOnSave Trueサイドバーの追加
https://docs.streamlit.io/develop/api-reference/layout/st.sidebar
必須というわけではないのですが、サイドバーを使ってアプリケーションの機能をうまく分割することで見通しが良くなる場合があります。今回はせっかくなのでサイドバーを使って、データ分析とは関係のない前処理的な部分とそれ以外に分けてみます。
import streamlit as st

uploaded_file = st.sidebar.file_uploader("Choose a CSV file", type="csv")

if uploaded_file is not None:
    st.write("filename:", uploaded_file.name)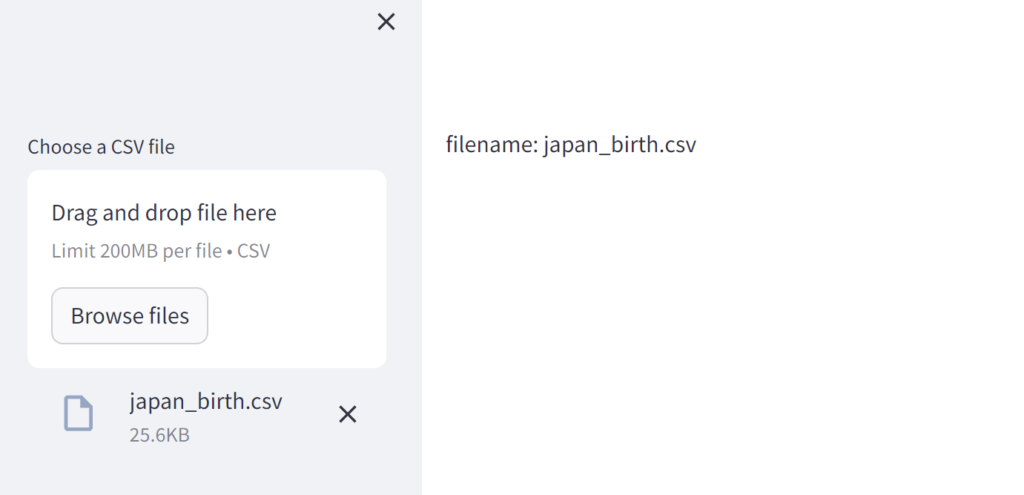
基本的なデータの出力
https://docs.streamlit.io/develop/api-reference/write-magic/st.write
先ほどからファイル名の表示のために使っていたst.write はStrealit においてデータをアプリ上に表示するための非常に強力な仕組みです。単なるテキストはもちろん、表やグラフの出力にも利用できます。
まずはdf.head() を表示してみます(ファイル名の表示は不要なので削除しました)。pandas がもしインストールされていなかったら適宜インストールしてください。
import streamlit as st
import pandas as pd

uploaded_file = st.sidebar.file_uploader("Choose a CSV file", type="csv")

if uploaded_file is not None:
    df = pd.read_csv(uploaded_file)
    st.write(df.head())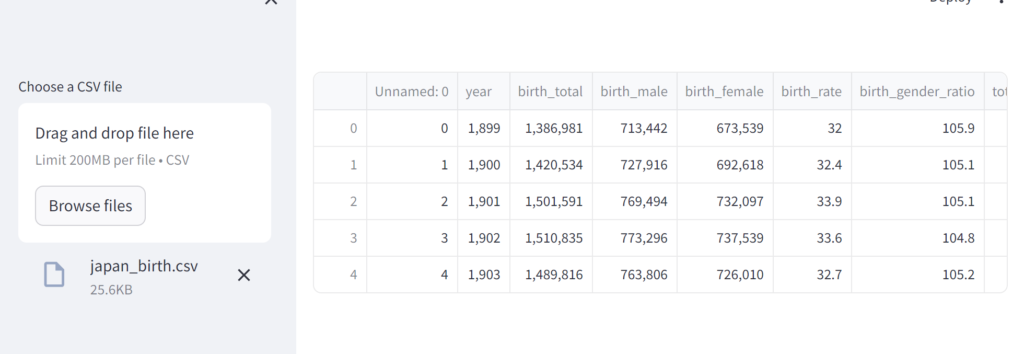
Jupyter Notebook やGoogle Colab に慣れていると、このように普段記述しているdf.head() をst.write の引数に入れるだけでアプリケーションに組み込めるあたりがStreamlit の魅力の1つですね。
チェックボックス
https://docs.streamlit.io/develop/api-reference/widgets/st.checkbox
df あるあるですが、入力したデータの形式から、先ほどのスクリーンショットのようにデータフレームの1列目がUnnamed になる場合があります。直接データを整形してもよいのですが割とよくあることなので、(ほかにもやり方はありますが)今回はチェックボックスで最初の列を削除するかどうか選択できるようにしてみます。
import streamlit as st
import pandas as pd

uploaded_file = st.sidebar.file_uploader("Choose a CSV file", type="csv")

if uploaded_file is not None:
    df = pd.read_csv(uploaded_file)
    delete_first_column = st.sidebar.checkbox("Delete the first column")
    if delete_first_column:
        df = df.iloc[:, 1:]
    st.write(df.head())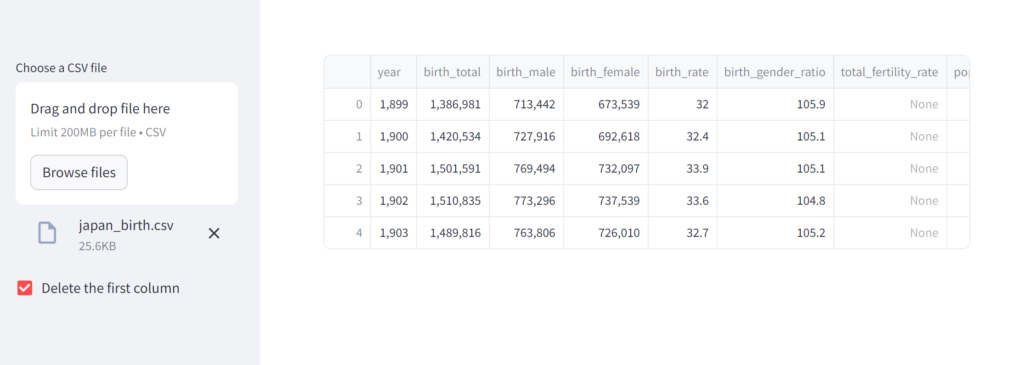
ついでに、合わせて叩くことが多いデータの統計量を表示するための df.describe() も表示してみましょう。
import streamlit as st
import pandas as pd

uploaded_file = st.sidebar.file_uploader("Choose a CSV file", type="csv")

if uploaded_file is not None:
    df = pd.read_csv(uploaded_file)
    delete_first_column = st.sidebar.checkbox("Delete the first column")
    if delete_first_column:
        df = df.iloc[:, 1:]
    st.write("Data Overview")
    st.write(df.head())

    st.write("Data Statistics")
    st.write(df.describe())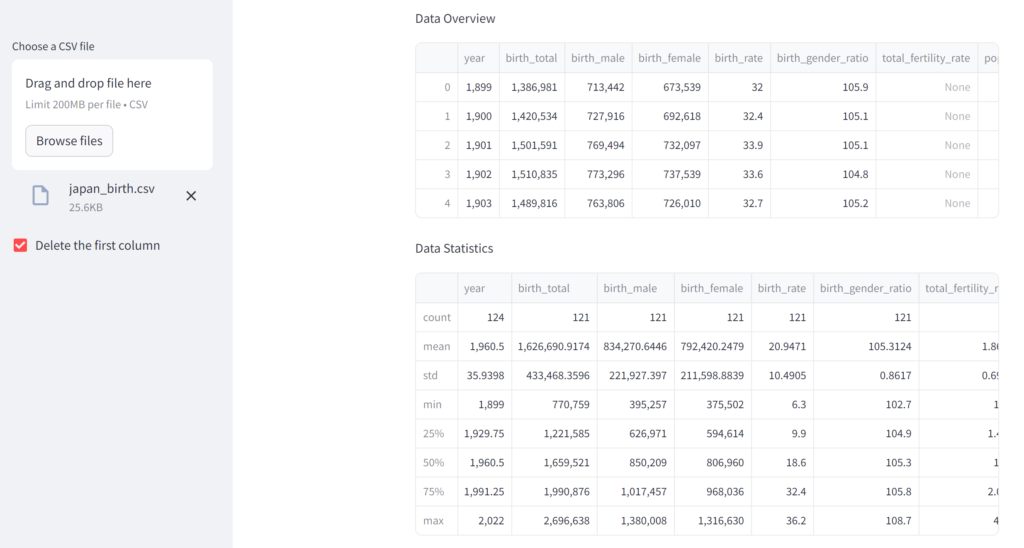
応用として、これも合わせて叩くことが多いdf.info() も表示してみようと思いますが、ちょっと工夫が必要です。df.info() はそもそもデフォルトで標準出力に出力されるので、これをバッファに渡してdf に変換してから st.write します。この辺り興味がある方は下記ドキュメントを参照してください。
https://pandas.pydata.org/docs/reference/api/pandas.DataFrame.info.html
import streamlit as st
import pandas as pd
import io

def info_to_df(df):
    buffer = io.StringIO()
    df.info(buf=buffer)
    info_string = buffer.getvalue()

    info_lines = info_string.split('\n')[3:-3]  # Adjusted to skip header and footer

    rows = []
    for line in info_lines:
        parts = line.split(maxsplit=3)
        if len(parts) == 4:
            # parts[0] is index, parts[1] is column name, parts[2] is non-null count, parts[3] is dtype
            column_name, non_null_count, dtype = parts[1], parts[2], parts[3]
            rows.append([column_name, non_null_count, dtype])
        else:
            print(f"Unexpected format")
            return None

    columns = ['Column', 'Non-Null Count', 'Dtype']
    info_df = pd.DataFrame(rows, columns=columns).iloc[2:]
    info_df.reset_index(drop=True, inplace=True)

    return info_df

uploaded_file = st.sidebar.file_uploader("Choose a CSV file", type="csv")

if uploaded_file is not None:
    df = pd.read_csv(uploaded_file)
    delete_first_column = st.sidebar.checkbox("Delete the first column")
    if delete_first_column:
        df = df.iloc[:, 1:]

    # Delete rows with null values and columns with more than half null values
    half_null_columns = df.columns[df.isnull().mean() >= 0.5]
    df.drop(columns=half_null_columns, inplace=True)
    df.dropna(inplace=True)

    # インデックスをリセット
    df.reset_index(drop=True, inplace=True)

    st.write("Data Overview")
    st.write(df.head())

    st.write("Data Information")
    st.write(info_to_df(df))

    st.write("Data Statistics")
    st.write(df.describe())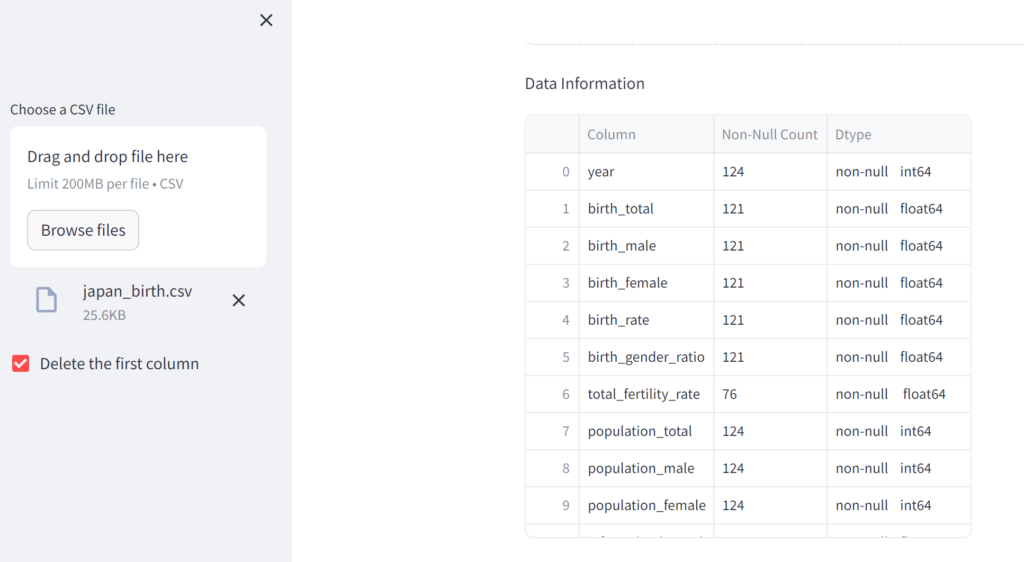
df.info() を見ると、欠損値を多く含むカラムが分かります。欠損値を含む行自体を削除したり、カラムごと削除するような機能を追加してもよいですが、今回は割愛します。
データの選択
https://docs.streamlit.io/develop/api-reference/widgets/st.selectbox
https://docs.streamlit.io/develop/api-reference/widgets/st.multiselect
この後の時系列データの表示のための準備として、どのデータを横軸(時間)にして、合わせてどのデータを縦軸にするかを選択できるようにしたいと思います。今回の出生率のデータでは西暦カラムがあるので、これと対応させてデータを表示させたいですが、仮にない場合はNone を選択することでインデックスを横軸と取るようにします。ここで使うst.selectbox は単一選択、st.multiselect は複数選択を表します。
import streamlit as st
import pandas as pd
import io

def info_to_df(df):
    buffer = io.StringIO()
    df.info(buf=buffer)
    info_string = buffer.getvalue()

    info_lines = info_string.split('\n')[3:-3]  # Adjusted to skip header and footer

    rows = []
    for line in info_lines:
        parts = line.split(maxsplit=3)
        if len(parts) == 4:
            # parts[0] is index, parts[1] is column name, parts[2] is non-null count, parts[3] is dtype
            column_name, non_null_count, dtype = parts[1], parts[2], parts[3]
            rows.append([column_name, non_null_count, dtype])
        else:
            print(f"Unexpected format")
            return None

    columns = ['Column', 'Non-Null Count', 'Dtype']
    info_df = pd.DataFrame(rows, columns=columns).iloc[2:]
    info_df.reset_index(drop=True, inplace=True)

    return info_df

uploaded_file = st.sidebar.file_uploader("Choose a CSV file", type="csv")

if uploaded_file is not None:
    df = pd.read_csv(uploaded_file)
    delete_first_column = st.sidebar.checkbox("Delete the first column")
    if delete_first_column:
        df = df.iloc[:, 1:]

    st.write("Time series analysis")
    time_column = st.selectbox('Select the Time column (or None to use index):', ['None'] + list(df.columns))
    selected_columns_for_time_analysis = st.multiselect('Select columns to display:', df.columns)

    st.write("Data Overview")
    st.write(df.head())

    st.write("Data Information")
    st.write(info_to_df(df))

    st.write("Data Statistics")
    st.write(df.describe())
グラフの表示
https://docs.streamlit.io/develop/api-reference/charts/st.pyplot
st.multiselect にてユーザによるデータの選択がなされたらグラフを描画するように条件分岐を書きます。
import streamlit as st
import pandas as pd
import io
import matplotlib.pyplot as plt

def info_to_df(df):
    buffer = io.StringIO()
    df.info(buf=buffer)
    info_string = buffer.getvalue()

    info_lines = info_string.split('\n')[3:-3]  # Adjusted to skip header and footer

    rows = []
    for line in info_lines:
        parts = line.split(maxsplit=3)
        if len(parts) == 4:
            # parts[0] is index, parts[1] is column name, parts[2] is non-null count, parts[3] is dtype
            column_name, non_null_count, dtype = parts[1], parts[2], parts[3]
            rows.append([column_name, non_null_count, dtype])
        else:
            print(f"Unexpected format")
            return None

    columns = ['Column', 'Non-Null Count', 'Dtype']
    info_df = pd.DataFrame(rows, columns=columns).iloc[2:]
    info_df.reset_index(drop=True, inplace=True)

    return info_df

uploaded_file = st.sidebar.file_uploader("Choose a CSV file", type="csv")

if uploaded_file is not None:
    df = pd.read_csv(uploaded_file)
    delete_first_column = st.sidebar.checkbox("Delete the first column")
    if delete_first_column:
        df = df.iloc[:, 1:]

    st.write("Time series analysis")
    time_column = st.selectbox('Select the Time column (or None to use index):', ['None'] + list(df.columns))
    selected_columns_for_time_analysis = st.multiselect('Select columns to display:', df.columns)

    if selected_columns_for_time_analysis:
        plt.figure(figsize=(10, 5))
        for column in selected_columns_for_time_analysis:
            if time_column != 'None':
                plt.plot(df[time_column], df[column], label=column)
            else:
                plt.plot(df.index, df[column], label=column)  # Use index as the time axis
        plt.xlabel('Time' if time_column != 'None (index)' else 'Index')
        plt.ylabel('Value')
        plt.title('Time Series Plot')
        plt.legend()

        st.pyplot(plt)

    st.write("Data Overview")
    st.write(df.head())

    st.write("Data Information")
    st.write(info_to_df(df))

    st.write("Data Statistics")
    st.write(df.describe())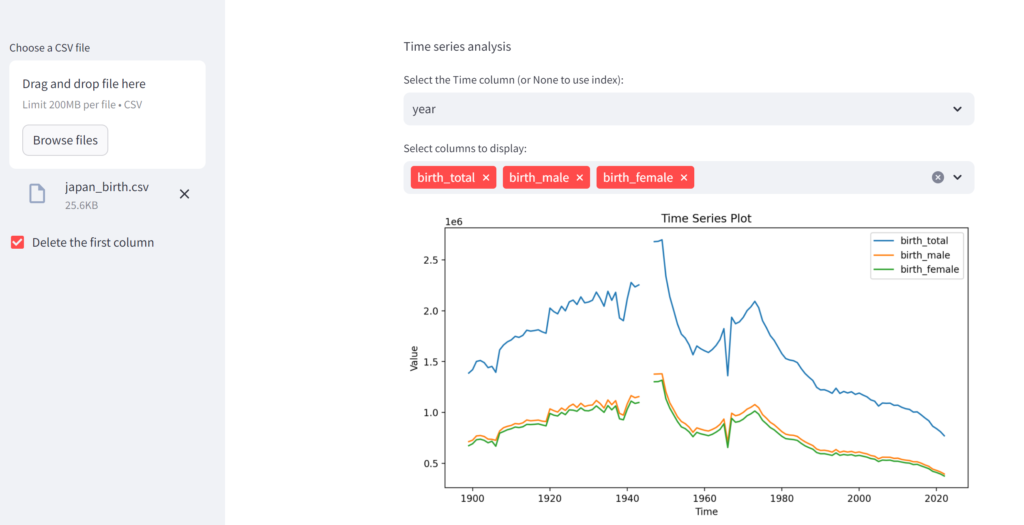
これで基本的なアプリケーションの形は出来上がりました。最後に、CSV アップロード時のエラーを防ぐエンコーディングの処理を一部付け加えることで、完成したコードが下記となります。
import streamlit as st
import pandas as pd
import io
import matplotlib.pyplot as plt

def info_to_df(df):
    buffer = io.StringIO()
    df.info(buf=buffer)
    info_string = buffer.getvalue()

    info_lines = info_string.split('\n')[3:-3]  # Adjusted to skip header and footer

    rows = []
    for line in info_lines:
        parts = line.split(maxsplit=3)
        if len(parts) == 4:
            # parts[0] is index, parts[1] is column name, parts[2] is non-null count, parts[3] is dtype
            column_name, non_null_count, dtype = parts[1], parts[2], parts[3]
            rows.append([column_name, non_null_count, dtype])
        else:
            print(f"Unexpected format")
            return None

    columns = ['Column', 'Non-Null Count', 'Dtype']
    info_df = pd.DataFrame(rows, columns=columns).iloc[2:]
    info_df.reset_index(drop=True, inplace=True)

    return info_df

uploaded_file = st.sidebar.file_uploader("Choose a CSV file", type="csv")

if uploaded_file is not None:
    encoding_options = ["Auto", "utf-8", "latin1", "ISO-8859-1", "cp1252"]
    encoding_type = st.sidebar.selectbox("Choose the encoding type of the CSV file", encoding_options)

    delete_first_column = st.sidebar.checkbox("Delete the first column")

    if encoding_type == "Auto":
        for enc in encoding_options[1:]:  # Try all encodings except 'Auto'
            uploaded_file.seek(0)
            try:
                df = pd.read_csv(uploaded_file, encoding=enc)
                st.sidebar.success(f"File read successfully with encoding: {enc}")
                break
            except UnicodeDecodeError:
                continue
        else:
            st.sidebar.error("Failed to read file with provided encodings.")
    else:
        df = pd.read_csv(uploaded_file, encoding=encoding_type)

    if delete_first_column:
        df = df.iloc[:, 1:]

    st.write("Time series analysis")
    time_column = st.selectbox('Select the Time column (or None to use index):', ['None'] + list(df.columns))
    selected_columns_for_time_analysis = st.multiselect('Select columns to display:', df.columns)

    if selected_columns_for_time_analysis:
        plt.figure(figsize=(10, 5))
        for column in selected_columns_for_time_analysis:
            if time_column != 'None':
                plt.plot(df[time_column], df[column], label=column)
            else:
                plt.plot(df.index, df[column], label=column)  # Use index as the time axis
        plt.xlabel('Time' if time_column != 'None (index)' else 'Index')
        plt.ylabel('Value')
        plt.title('Time Series Plot')
        plt.legend()

        st.pyplot(plt)

    st.write("Data Overview")
    st.write(df.head())

    st.write("Data Information")
    st.write(info_to_df(df))

    st.write("Data Statistics")
    st.write(df.describe())
アプリケーションのデプロイ
Streamlit はコミュニティクラウドというデプロイの仕組みがあります。リソースは限られていますが無償でデプロイできて公開できますので、先ほど作成したアプリのデプロイを試してみましょう。下記ドキュメントの手順に沿ってアカウント登録を行います。今回はすでにアプリケーションを作成しているため、下記ドキュメントのCreate a new app with GitHub Codespaces は実行せず、最初のSign up for Streamlit Community Cloud のみを実行します。
https://docs.streamlit.io/deploy/streamlit-community-cloud/get-started/quickstart
内部的にはおそらく軽量なコンテナが立ち上がり、github のリポジトリから同期したファイルの中のrequirements.txt のパッケージをインストールしてアプリケーションファイルを実行する流れだと思います。それゆえgithub は必須ですし、リソースも無償だとかなり限られたものになります。
https://docs.streamlit.io/deploy/streamlit-community-cloud/manage-your-app#app-resources-and-limits
アカウント登録ができたら、下記ドキュメントに従いデプロイを進めます。今回は特に環境変数の読み込みなどは必要ないため、main.py とこの後出力するrequirements.txt のみをgithub にアップロードしていきます。
https://docs.streamlit.io/deploy/streamlit-community-cloud/deploy-your-app
下記コマンドでアプリケーションの依存関係であるところのパッケージとバージョンが記載されたrequirements.txt を出力します。
pip freeze > requirements.txt今回はgit/github は使っておらず、コミュニティクラウドへのデプロイが目的なので、github 側でリポジトリを作成した後ブラウザからアップロードします。
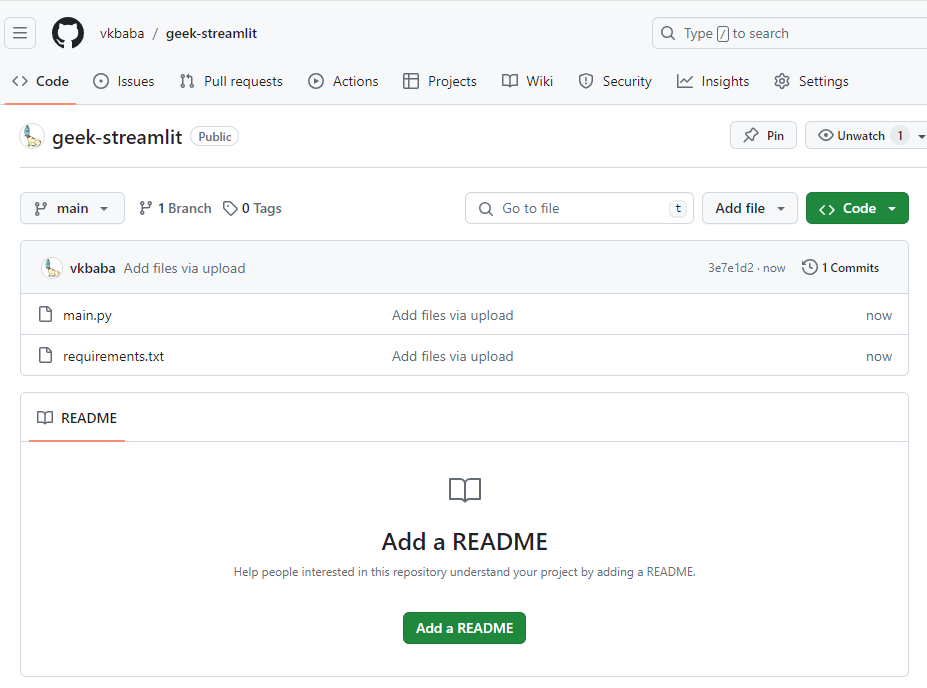
コミュニティクラウドのページに戻り、New app → Use existing repo を選択してアプリのデプロイに進むと、github のリポジトリやブランチ等を選択できますので、先ほどアップロードした情報を入力してアプリケーションのデプロイをします。
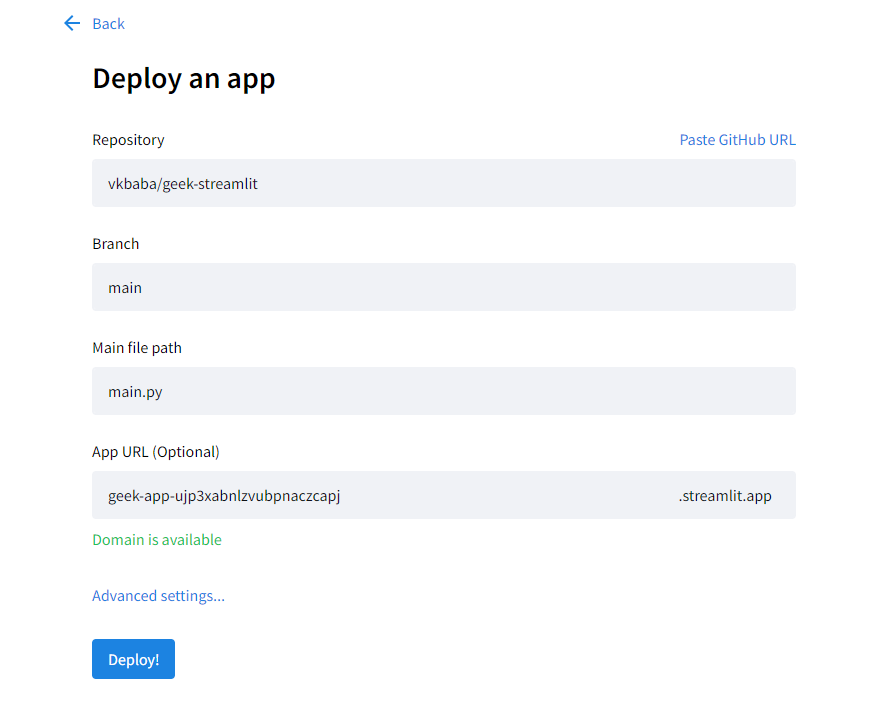
すべて完了すると、公開用のURL が払い出され、作成したアプリが全世界に公開されるようになります!
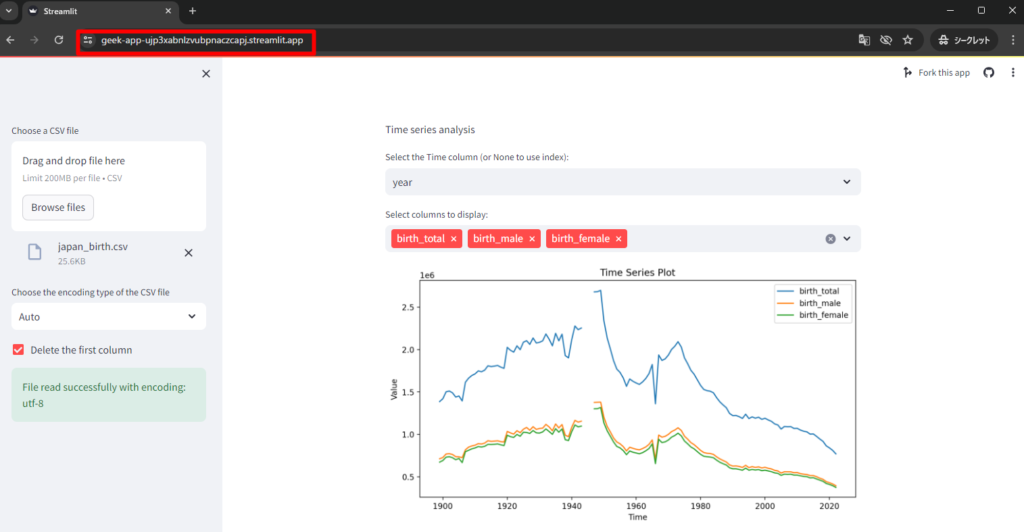
まとめ
本記事ではアプリケーションの作成を通して基本的なStreamlit の使い方を紹介しました。また、コミュニティクラウドを使ったデプロイによる外部公開をすることで、自分の作ったアプリケーションを簡単に世界に公開できるようになります。
なお、今回は簡単なデータの可視化であったためにすべてStreamlit で完結させることができ、それゆえバックエンドサービスとの連携については触れていませんが、機械学習を組み込んだアプリケーションを作るためにFastAPI などバックエンド側での処理が必要になった場合はAPI 連携のための追加のコードが必要になり(とはいえPython に慣れていたら大丈夫だと思います)、デプロイする場合は別のバックエンドサービスの検討が必要になります。例えばコミュニティクラウドではFastAPI は実行できませんので、https://fly.io/ などのサービスを使ってホストする必要があることに注意してください。